
What's New
April 4, 2019
Geneious Biologics is always evolving and we’ve added new functionality designed to improve the workflows for biologic drug development including visualizing similarity clusters in alignments, quickly summarizing families of sequences with sequence logos and Unique Molecular Identifier (UMI) processing.
Visualize Similarity Clusters in Alignments
Geneious Biologics provides information about identity and similarity clusters, with user-defined similarity thresholds and regions, in a tabular format. It is now possible to visualize selected clusters in alignments, associated with heatmaps of relevant data, such as the number of sequences in a specific cluster, cluster frequency, number of unique sequences in a cluster (for similarity clustering) and any other connected metadata you define. This allows you to condense big datasets into a greatly summarized visualization and keep all the relevant information together, so you can understand relationships between families of sequences.
Reduce the complexity of a high-throughput dataset many-fold. For example, in Table 1 we outline the number of sequences at different stages of analyses, from the raw sequencing run to the number of sequences visualized in the cluster alignment (SRA accession number: ERR346600 (2) )
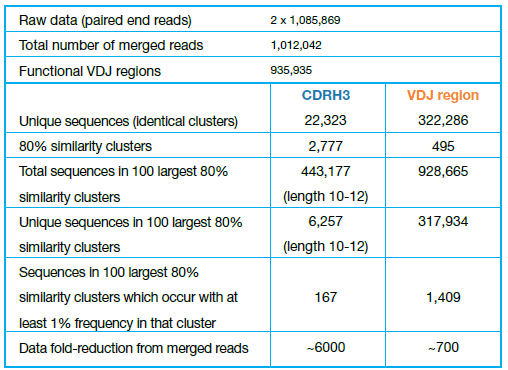
Table 1 – Number of sequences at different stages of the analysis
Interlaced reads were paired and merged using default parameters in Geneious Biologics. Clustering results report only functional regions (fully annotated, without frameshifts or stop codons).
Re-clustering refers to the similarity clustering post-processing step performed at 80% similarity with default settings.
The total number of CDRH3 sequences of length 10-12 included in the largest 100 clusters is 443,177, comprising 6,257 unique sequences, 167 of which are represented in at least 1% of the sequences within each cluster. This means a ~6000-fold reduction in data complexity from the raw sequences after merging (1.012M) to the 167 CDRH3 sequences clustered and aligned (Figure 1).
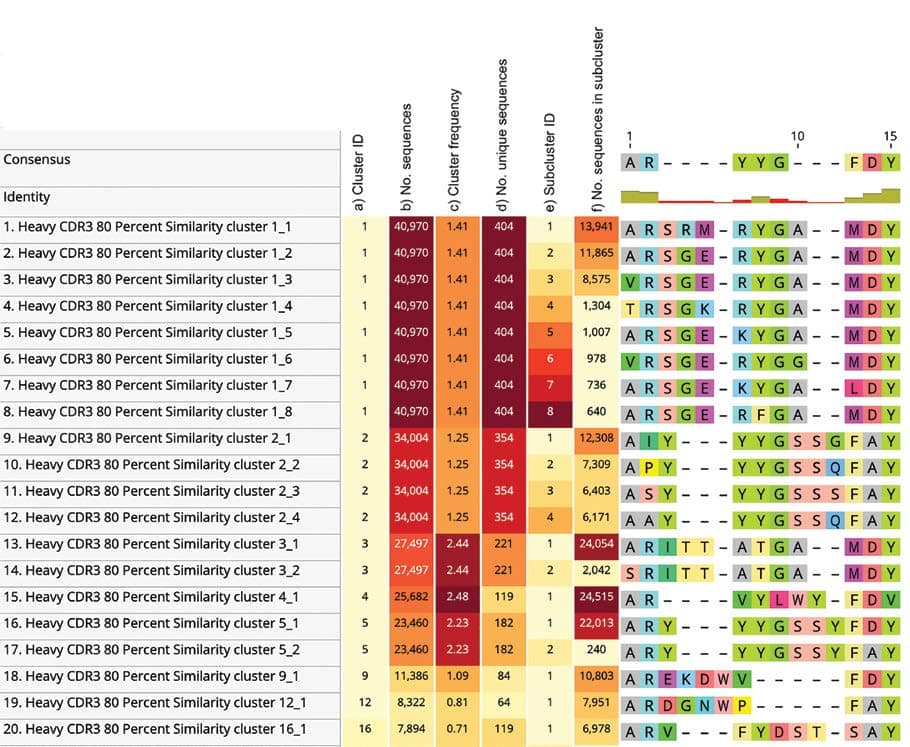
Figure 1 – Top view of the alignment of the largest 100 CDRH3 sequence similarity clusters (80%) between length 10 and 12.
The heat maps shown on the left-hand side of the graph represent:
a) cluster ID
b) total number of sequences in that cluster
c) frequency of that cluster
d) total number of unique sequences in that cluster
e) ID of subcluster (cluster of identical sequences within the same similarity cluster)
f) count of sequences in subcluster
Quickly Summarize Families of Sequences with Sequence Logos
Geneious Biologics provides sequence logo visualizations for similarity clusters and alignments. We have now added the Shannon entropy based sequence logo to understand the depth of cluster or alignment data based on positional amino acid content (Figure 2). Note that a variety of amino acid coloring options are available, e.g. hydrophobicity, polarity, RasMol, Clustal, Structural amino acids, and Cysteines highlighting.
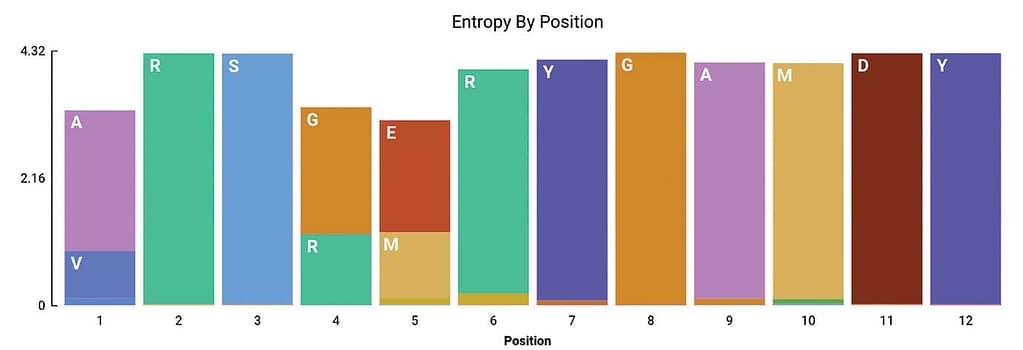
Figure 2 – Entropy by position
Shannon entropy sequence logo (in bits) for re-clustering of the most frequent similarity clustering of CDRH3 based on 80% similarity (ERR346600).
Unique Molecular Identifier (UMI) Processing
We have added support for a preprocessing step that allows for UMI identification and consensus building. We support both single and double UMI barcodes, optionally allow for single mismatches within the UMI barcode and check for sequence identity when clustering (similarity threshold user defined). Within the same operation, it is possible to remove short sequences (below a user’s specified threshold) and filter by quality. UMI statistics are available in downstream analysis so you can be confident in your results.
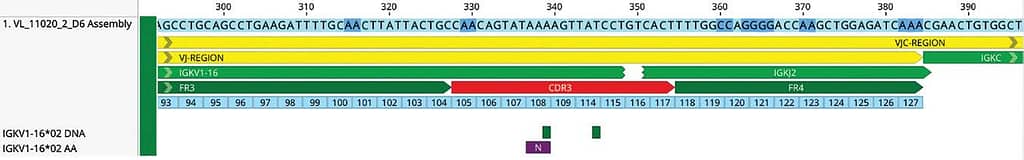
Figure 3 – IMGT Numbering
Amino acid positions are numbered and displayed in the sequence viewer following the IMGT numbering.
Other General Improvements
We continuously improve and enhance the functionalities and performance of Geneious Biologics with a high development pace. Among others, some of the most recent improvements include:
- CSV export from result tables for easy integration with other software
- Pair heavy and light chains
- IMGT numbering scheme for individual positions (Figure 3)
- Improved repertoire comparison including filtering options
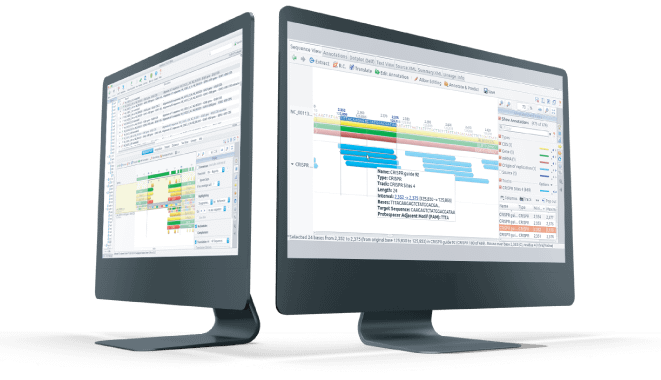
- Seamless integration between Geneious Prime and Geneious Biologics
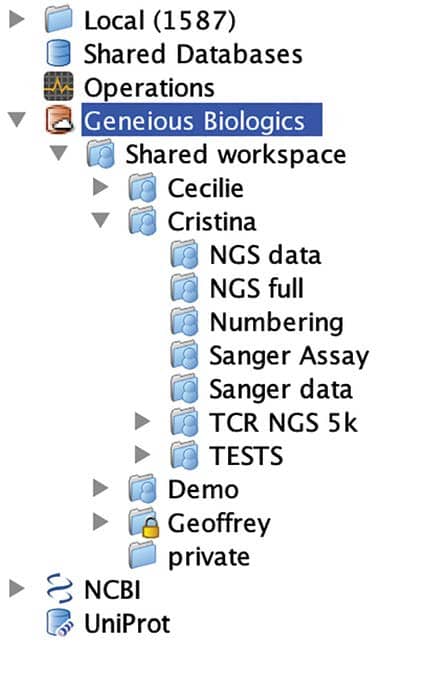
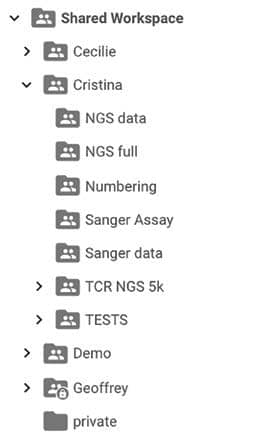
Figure 4 – Geneious Prime Integration
Folders and documents created in both Geneious Biologics (on the right) and Geneious Prime (on the left) are synchronized in real time. Your team can now perform library screening in Geneious Biologics, hit save and have the data immediately accessible by your downstream cloning team in Geneious Prime.
Other Sequence Viewer Improvements
- Hide nucleotides to only show translation in DNA alignments
- Sort sequences by metadata values or residues in alignment
- Set and pin a reference sequence within an alignment
- Adjustable width for the labels sidebar
- Easy identification of paired reads
Take the First Step
Discover how Geneious tools and services can help you simplify and empower sequencing research and analysis. Contact us for a customized product demo and consultation.